Innovative visualizations for web analytics
Speak with an expert in the Innovative visualizations for web analytics product
Request a demo

Need
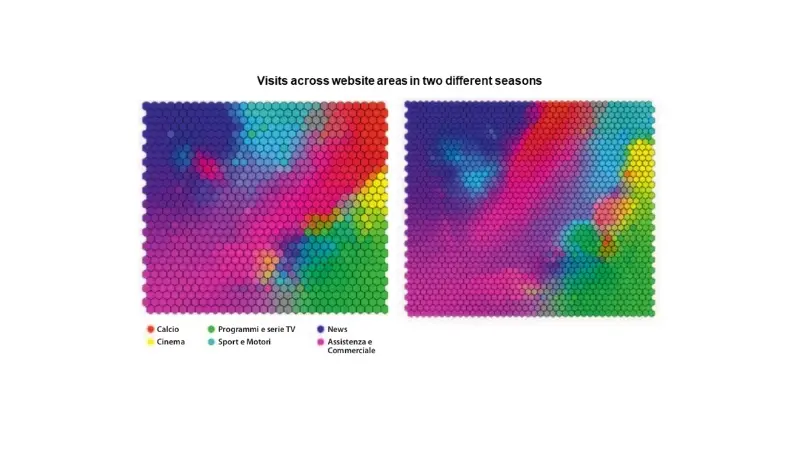
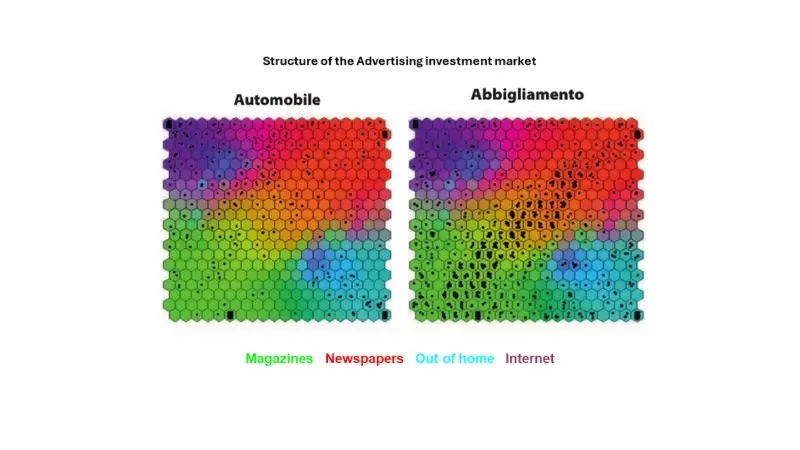
A new method to represent available data - in our use cases web logs of anonymous users on the client’s site(s) and advertising investment data of Italian companies.

Approach
Utilized customized Kohonen maps (neural maps) to create a meaningful, human-readable two-dimensional representation of a multidimensional environment.

Result
Server-side solution that processes complex, multidimensional data and visualizes it through easily readable and interpretable maps to support strategic decision-making.
Categories
Type
AI & Data Science
Need
Benefit
Business function
Industry
Business Model
Business Size